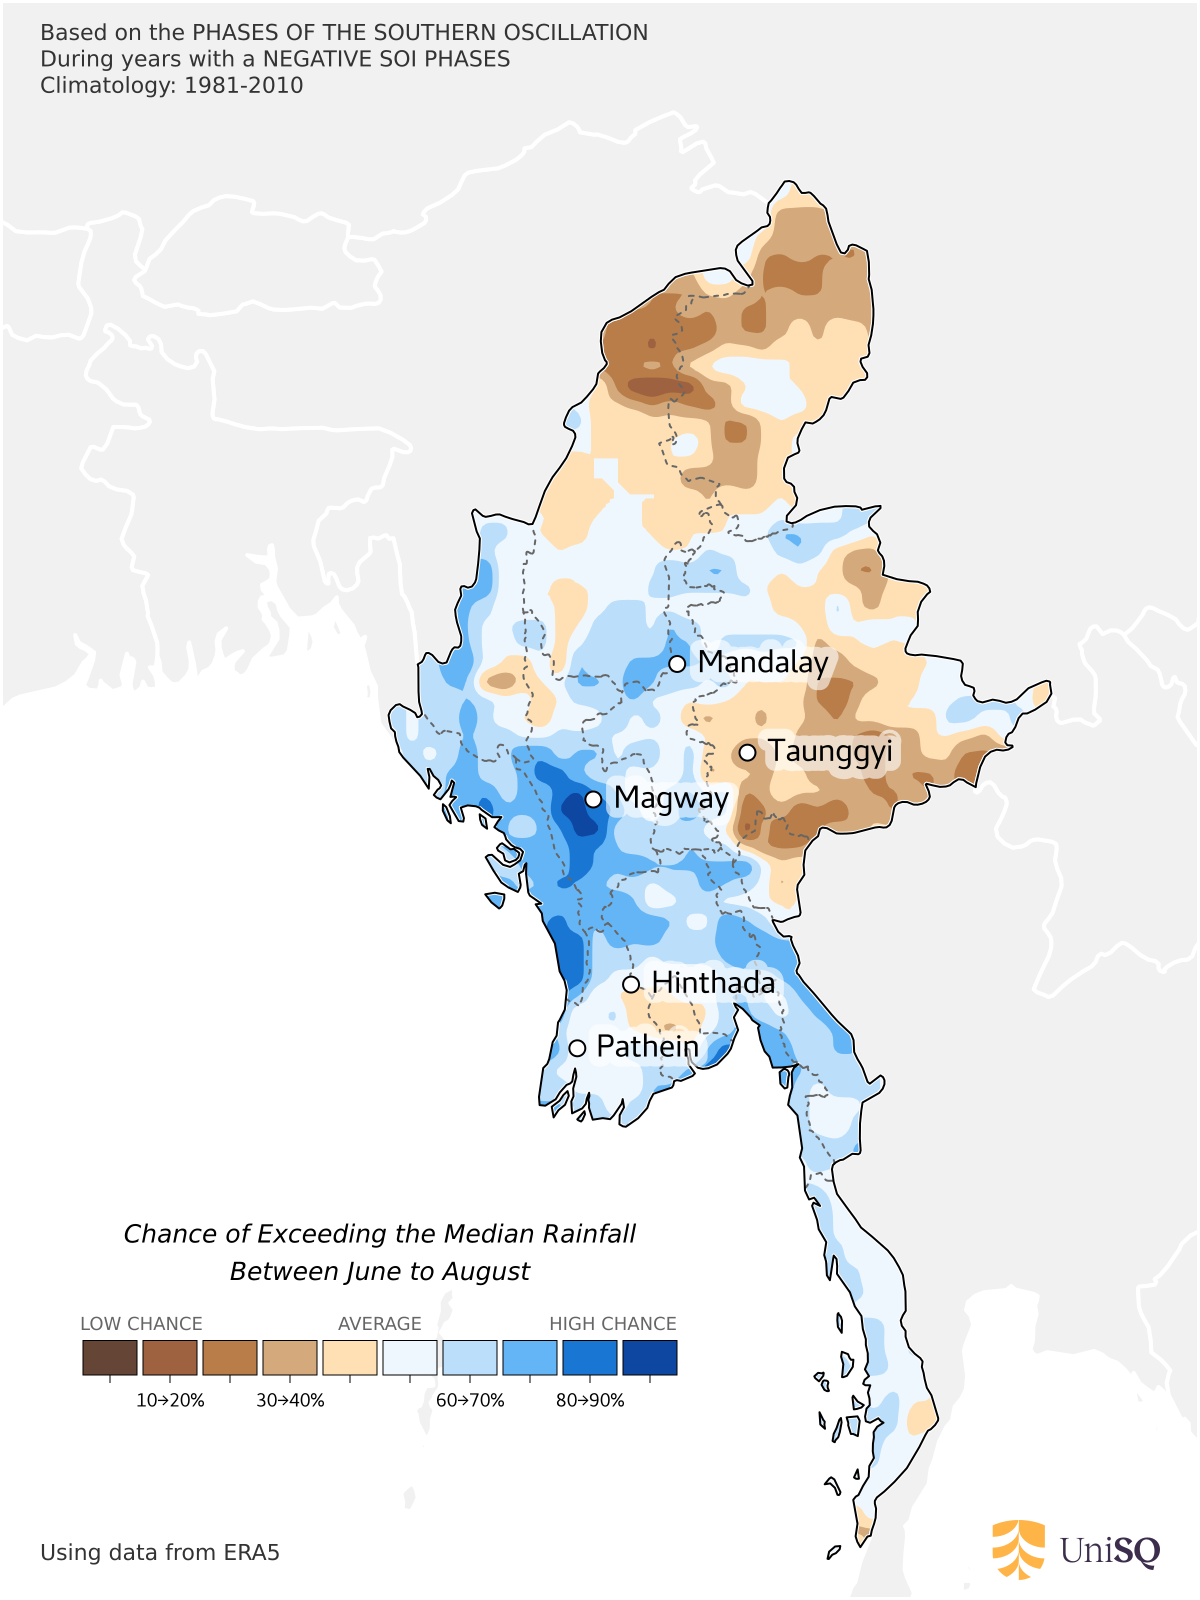
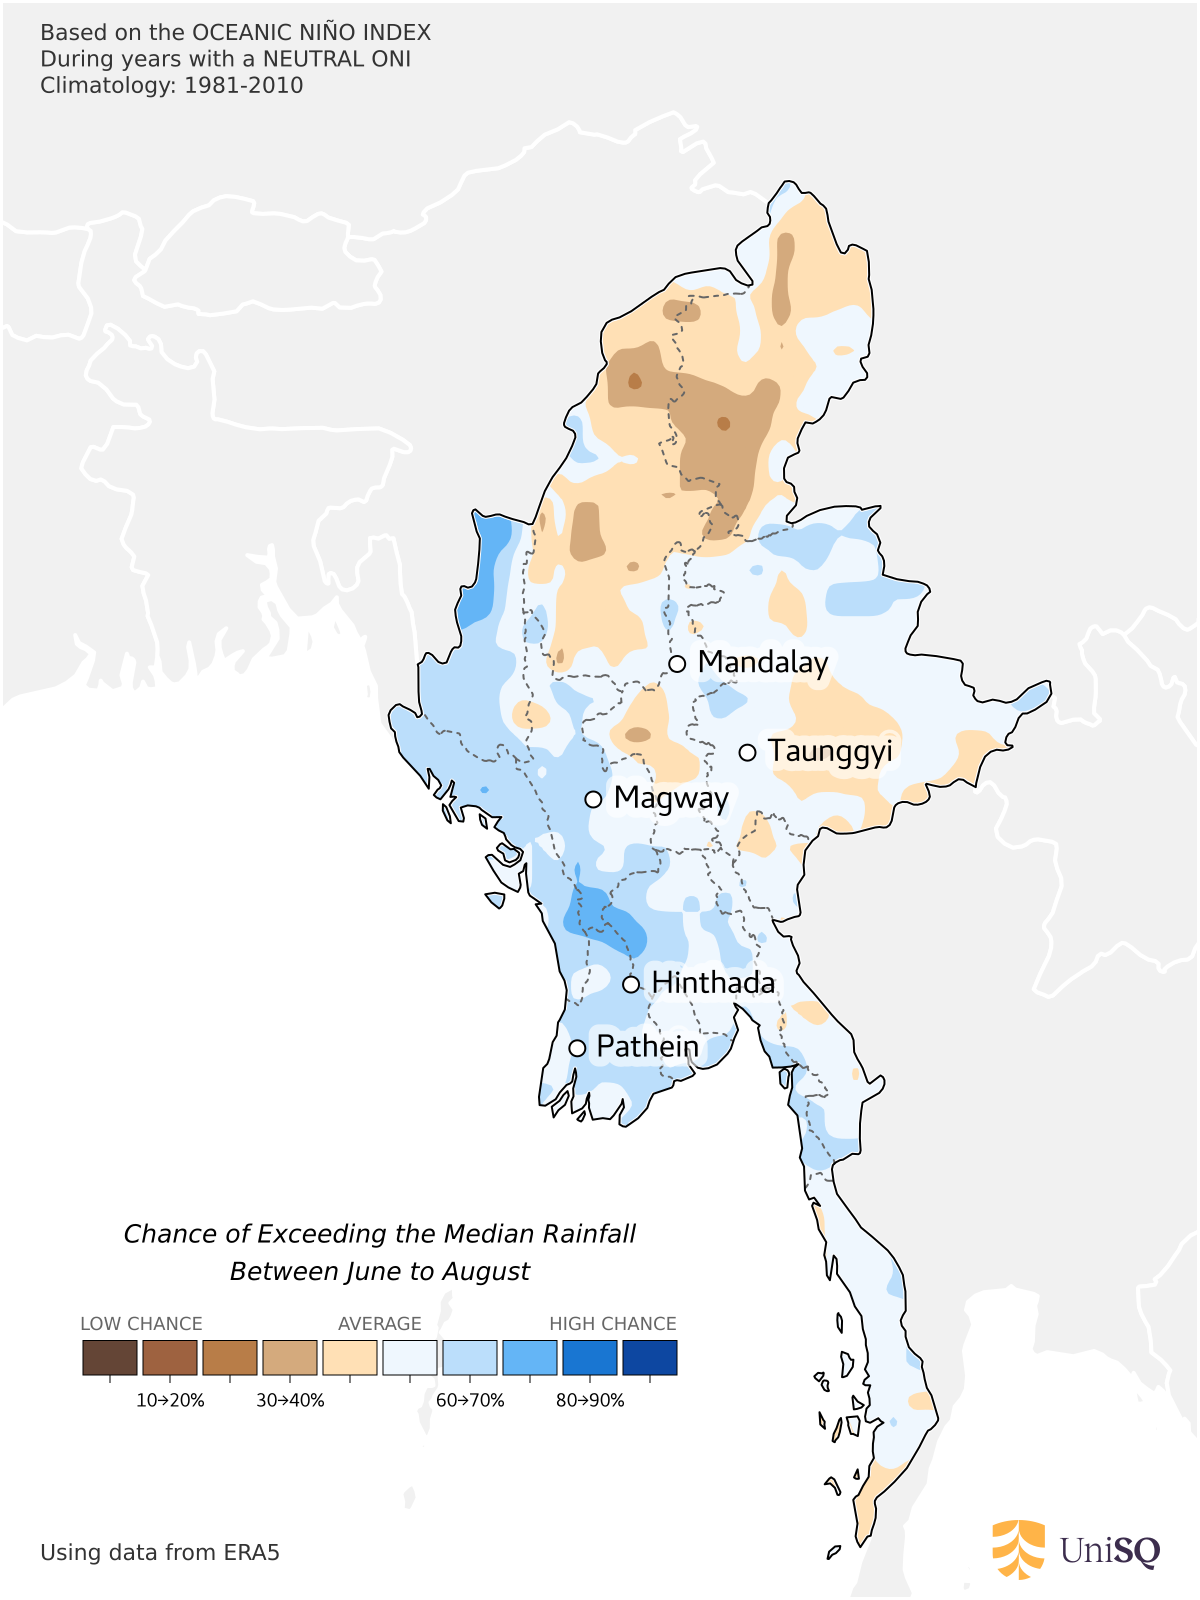
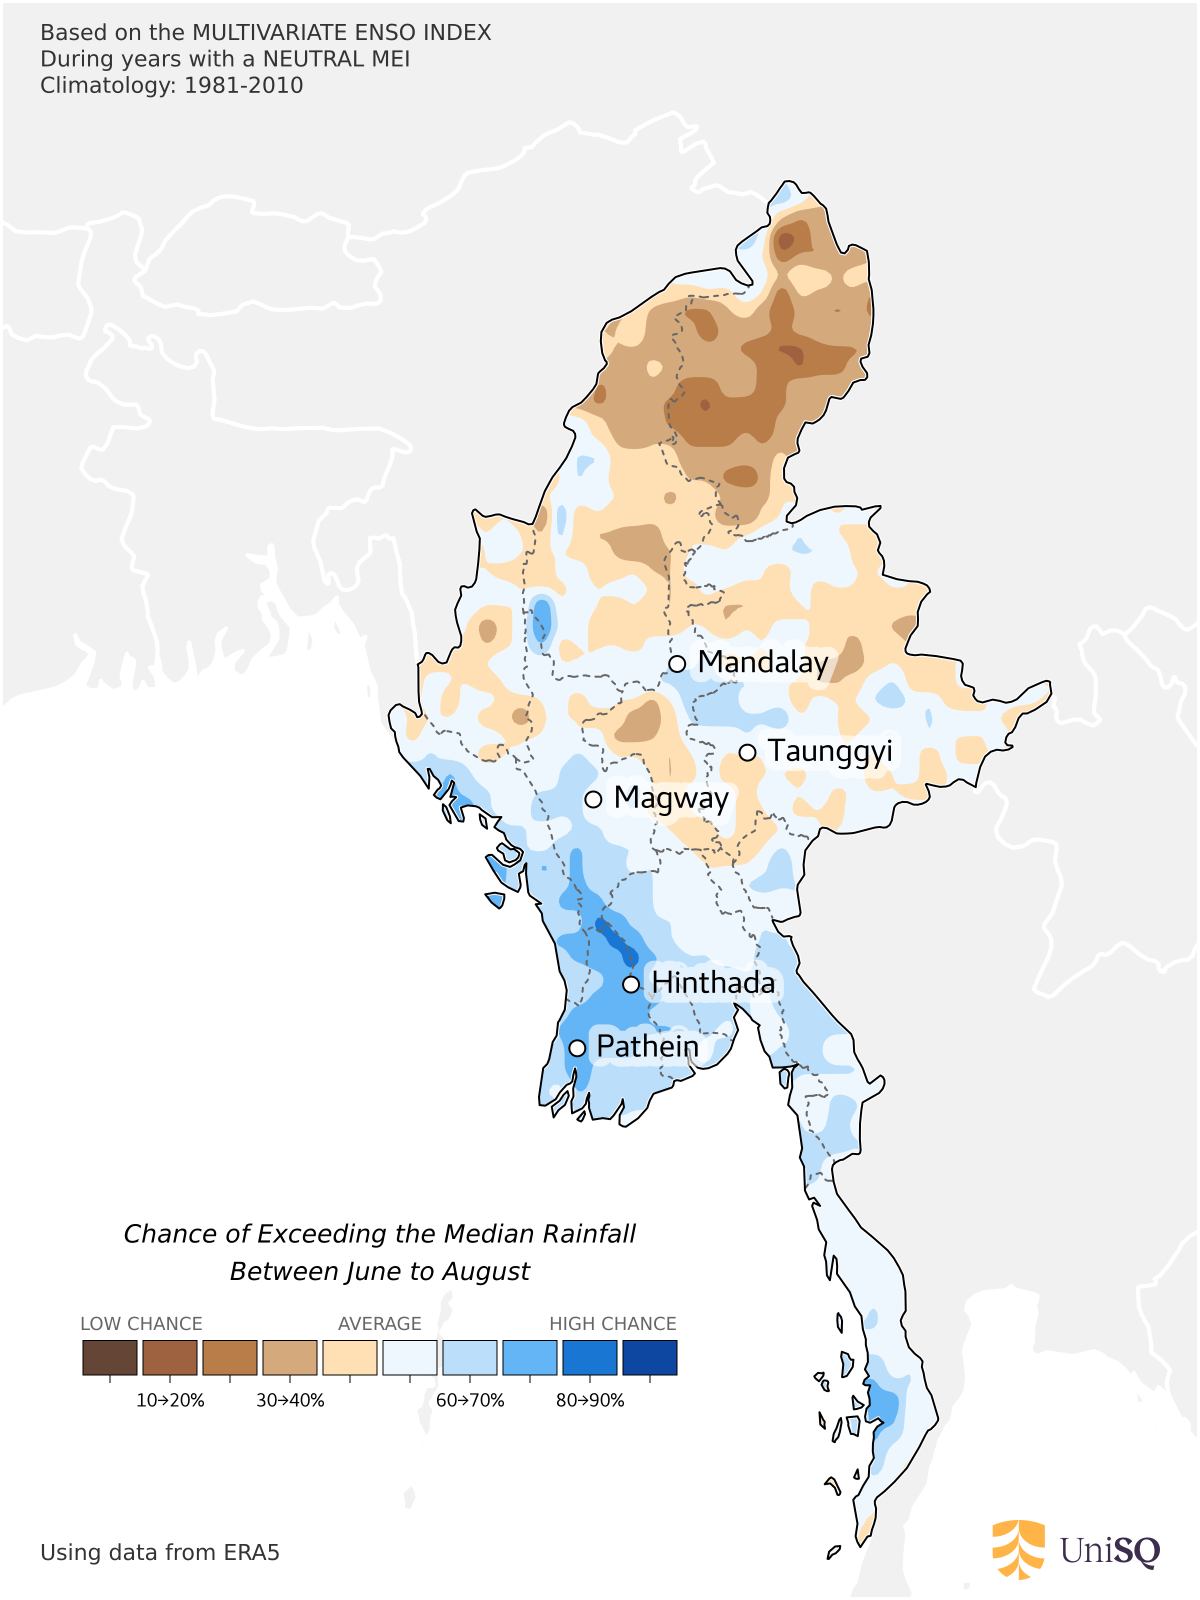
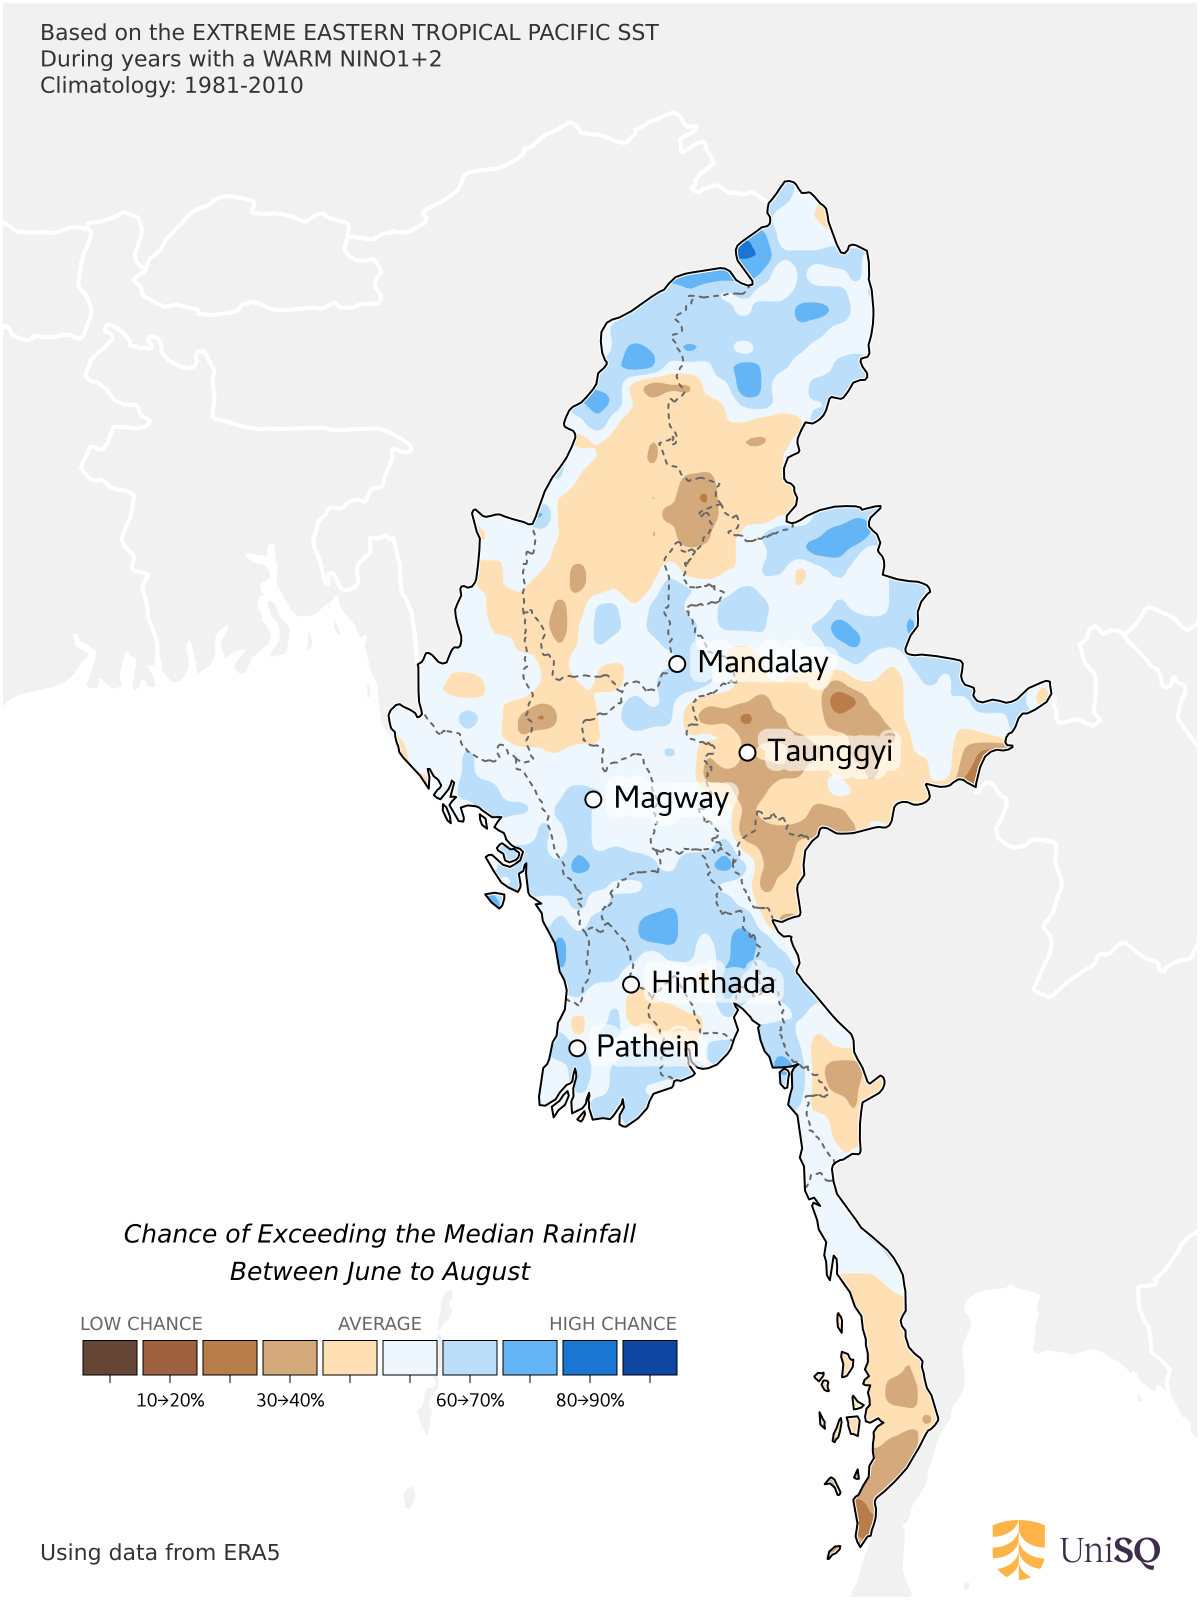
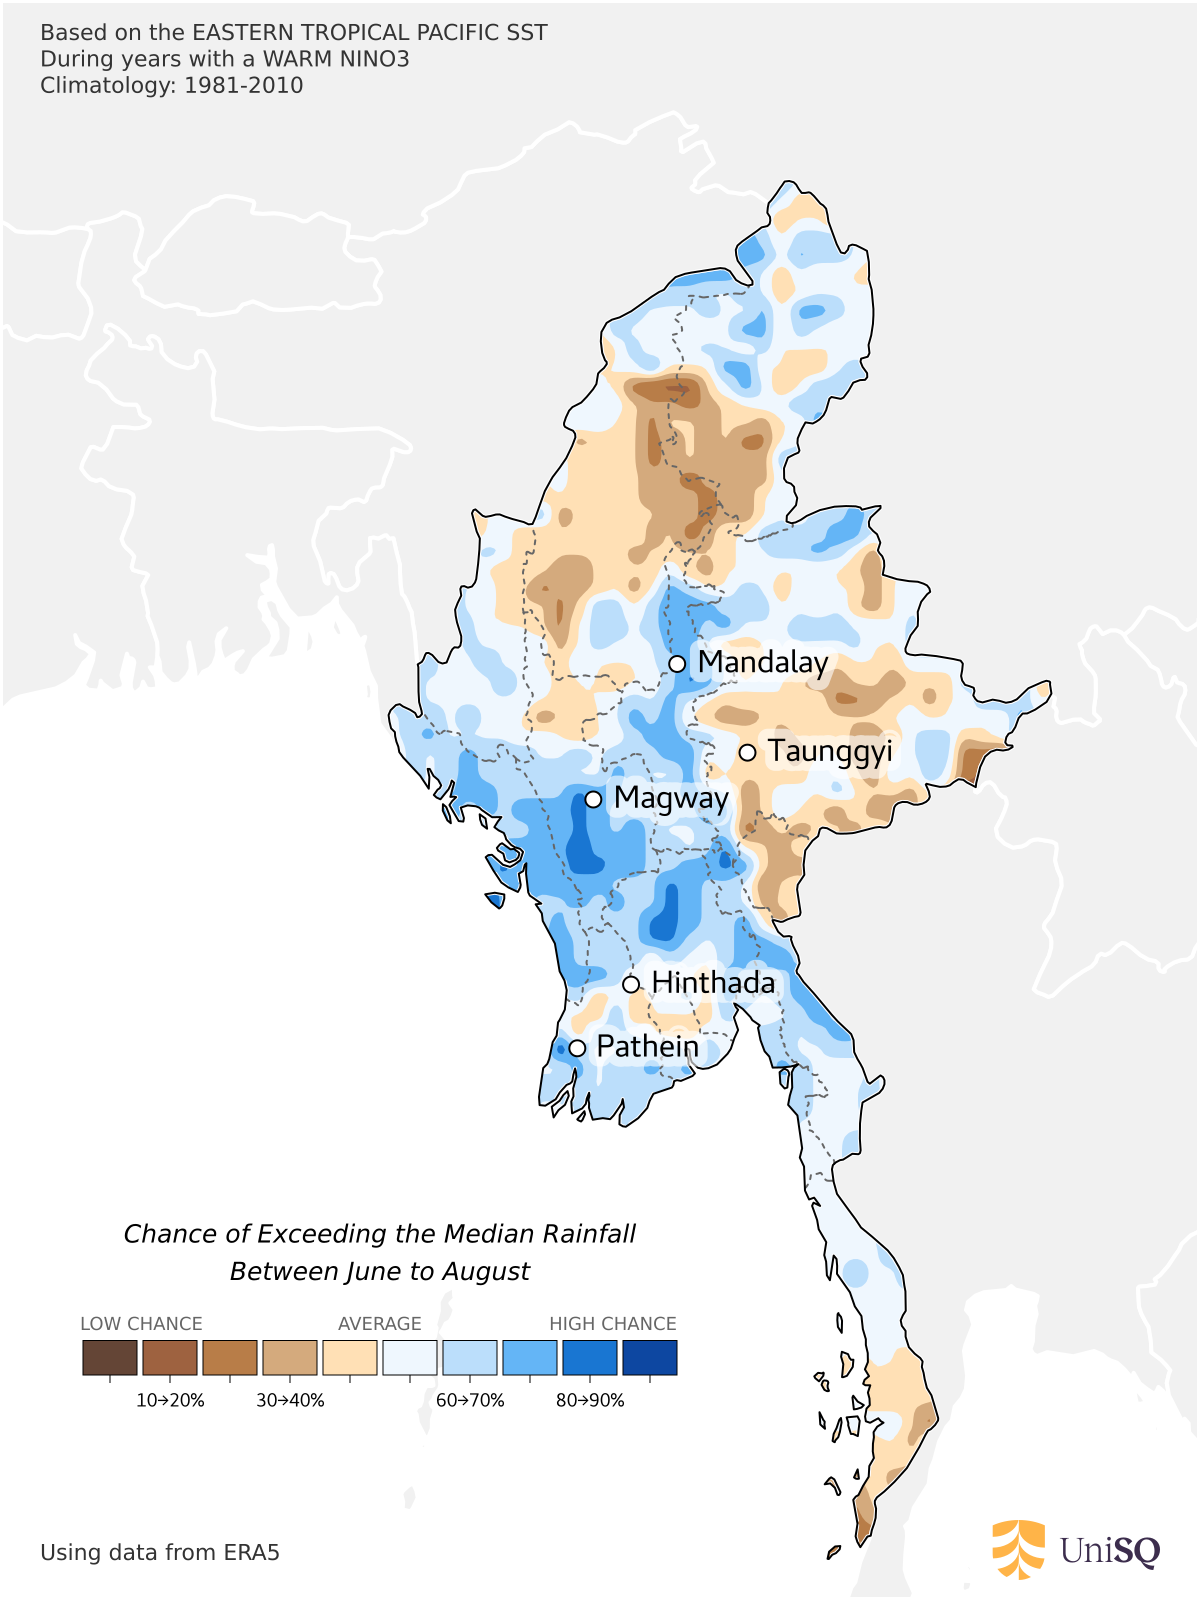
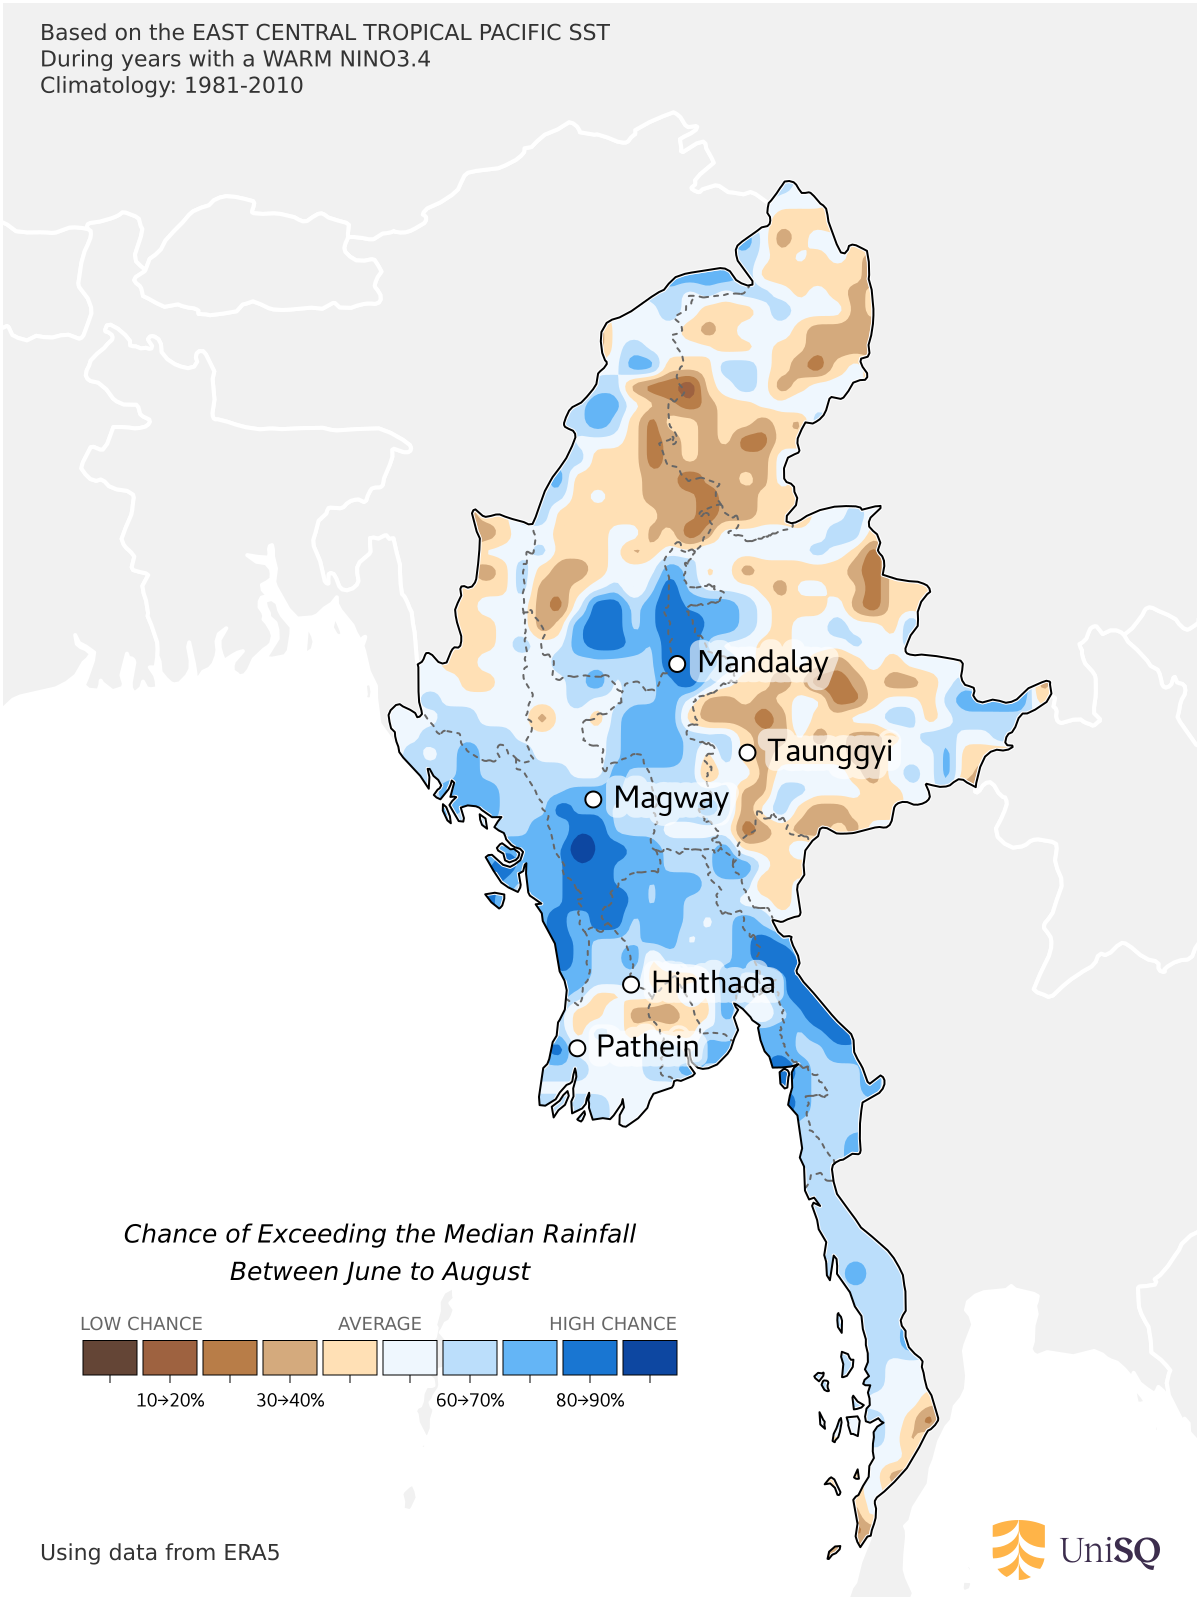
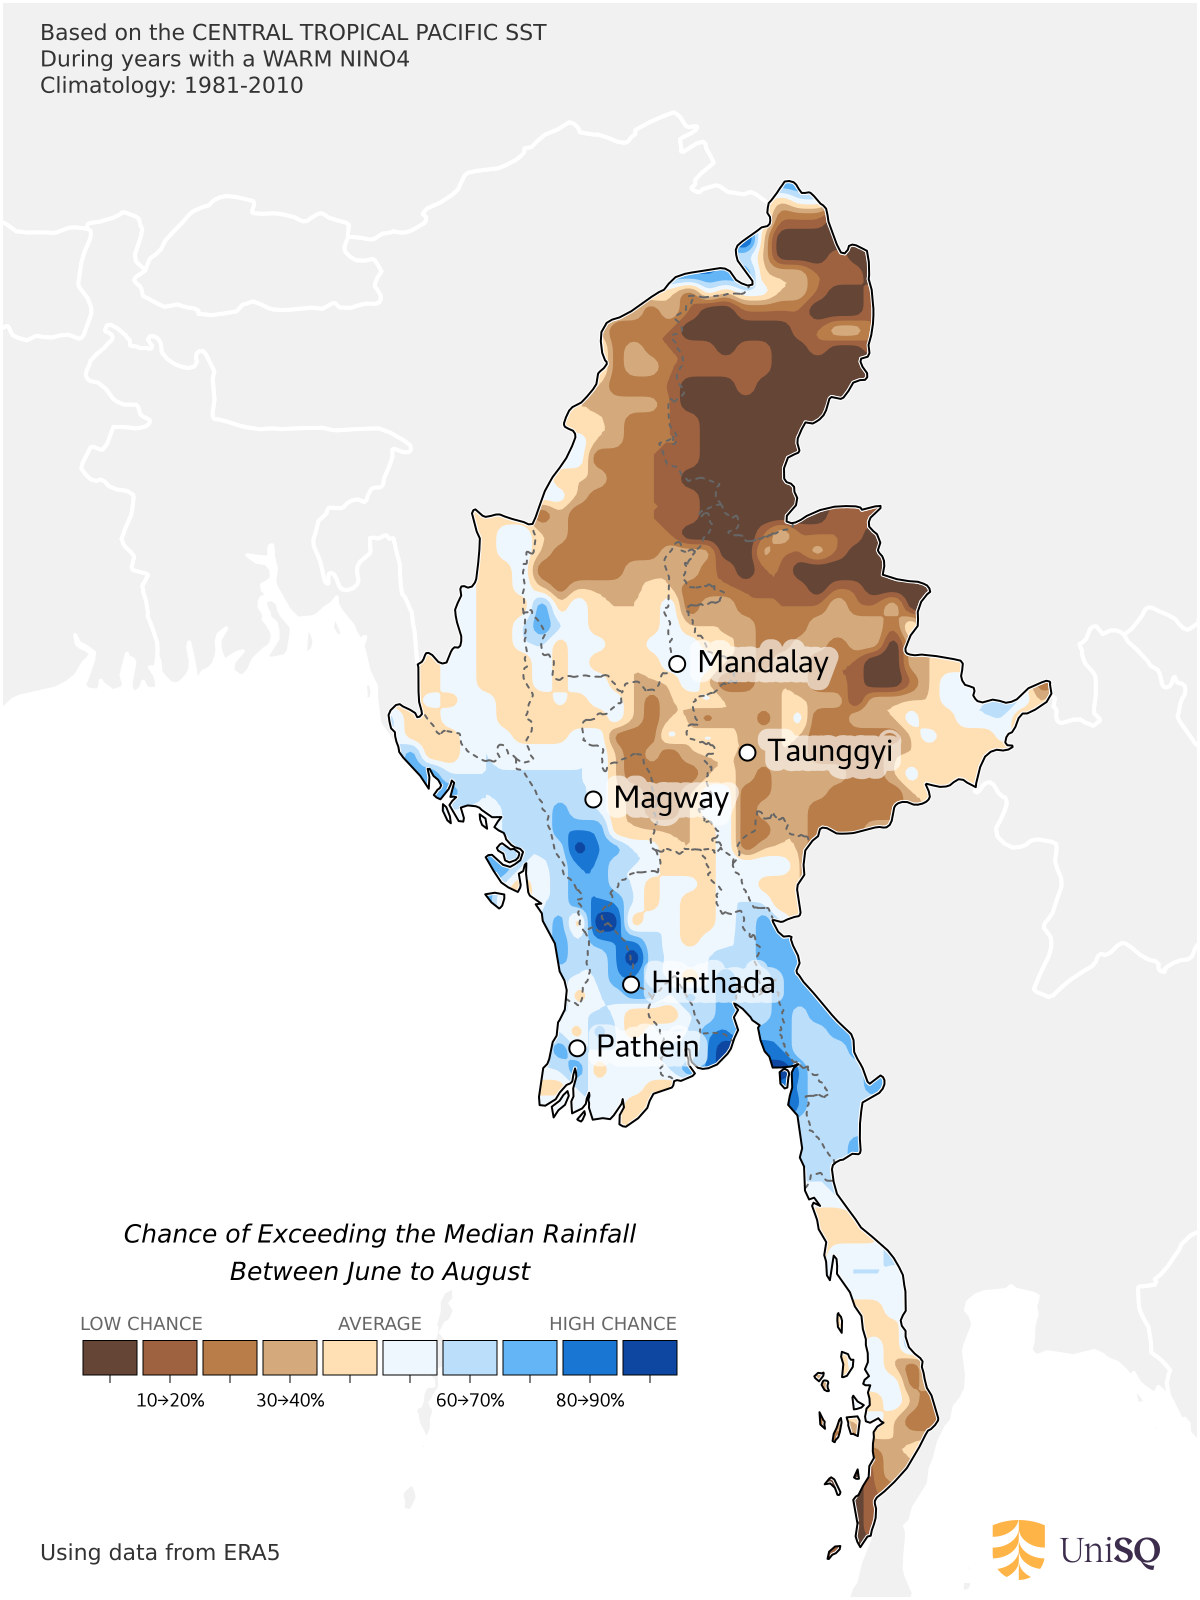
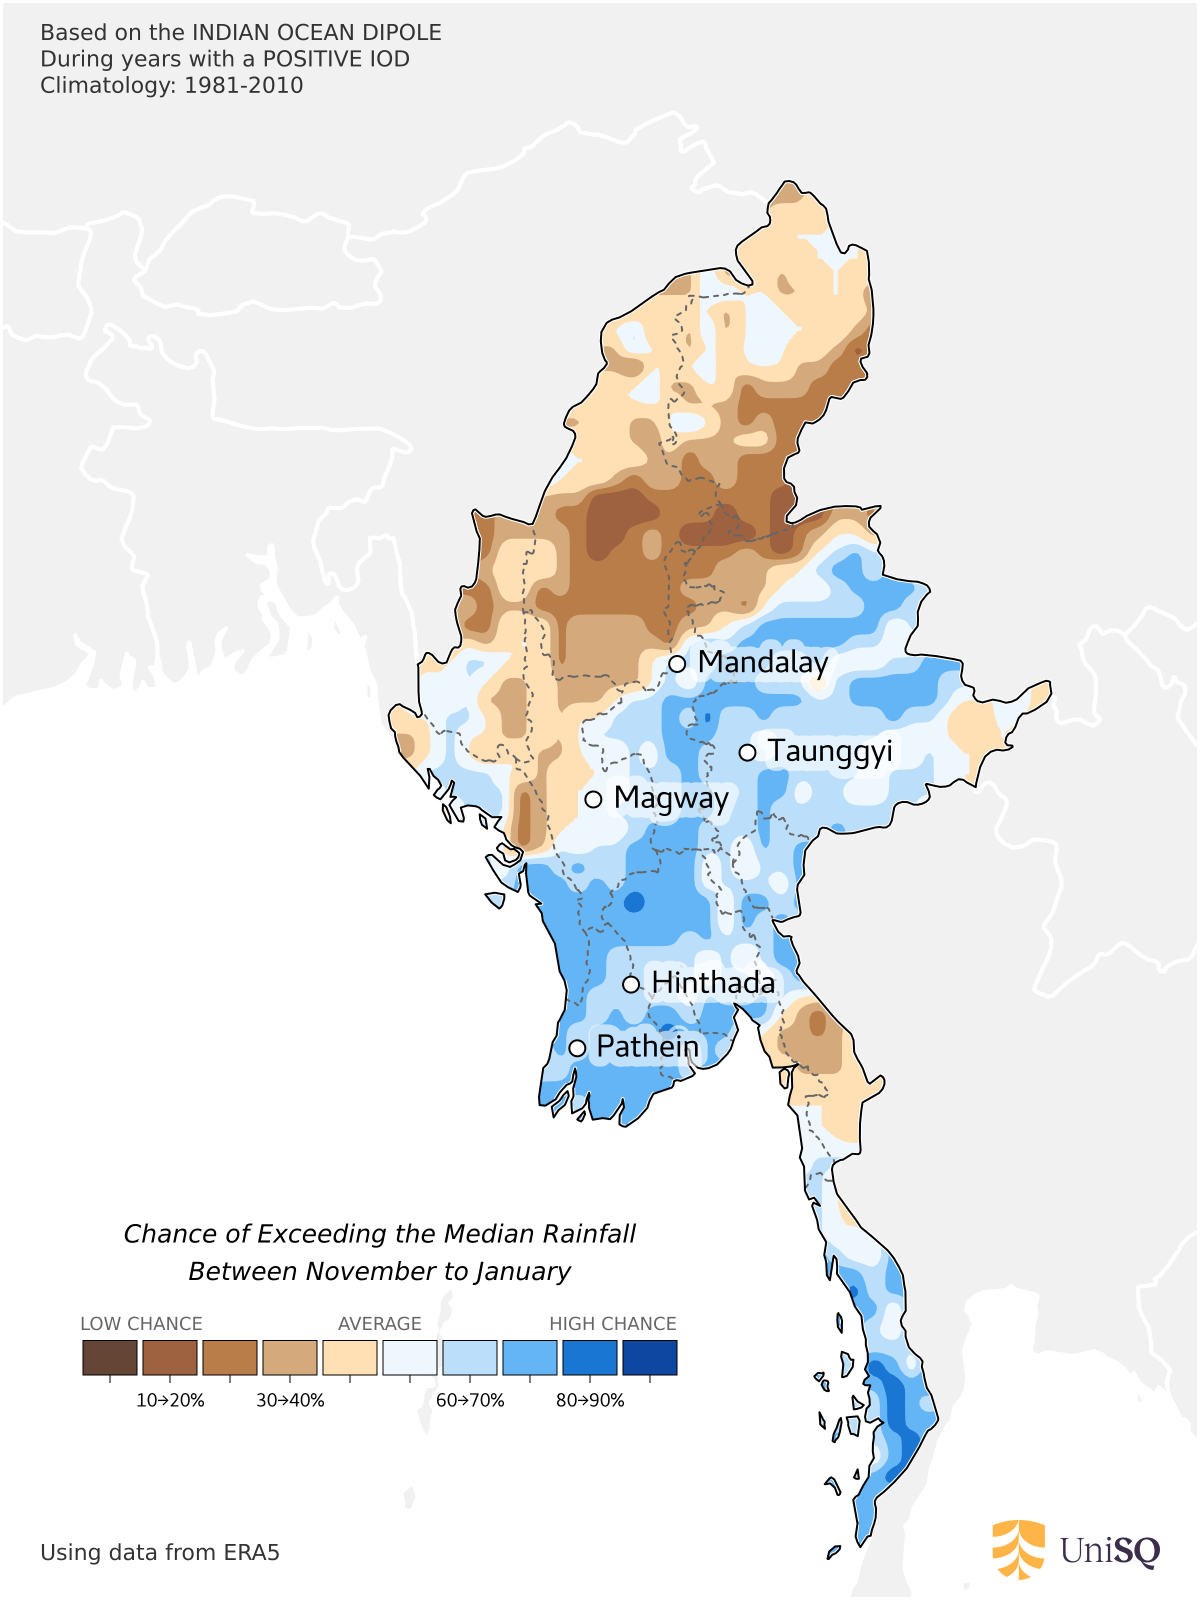
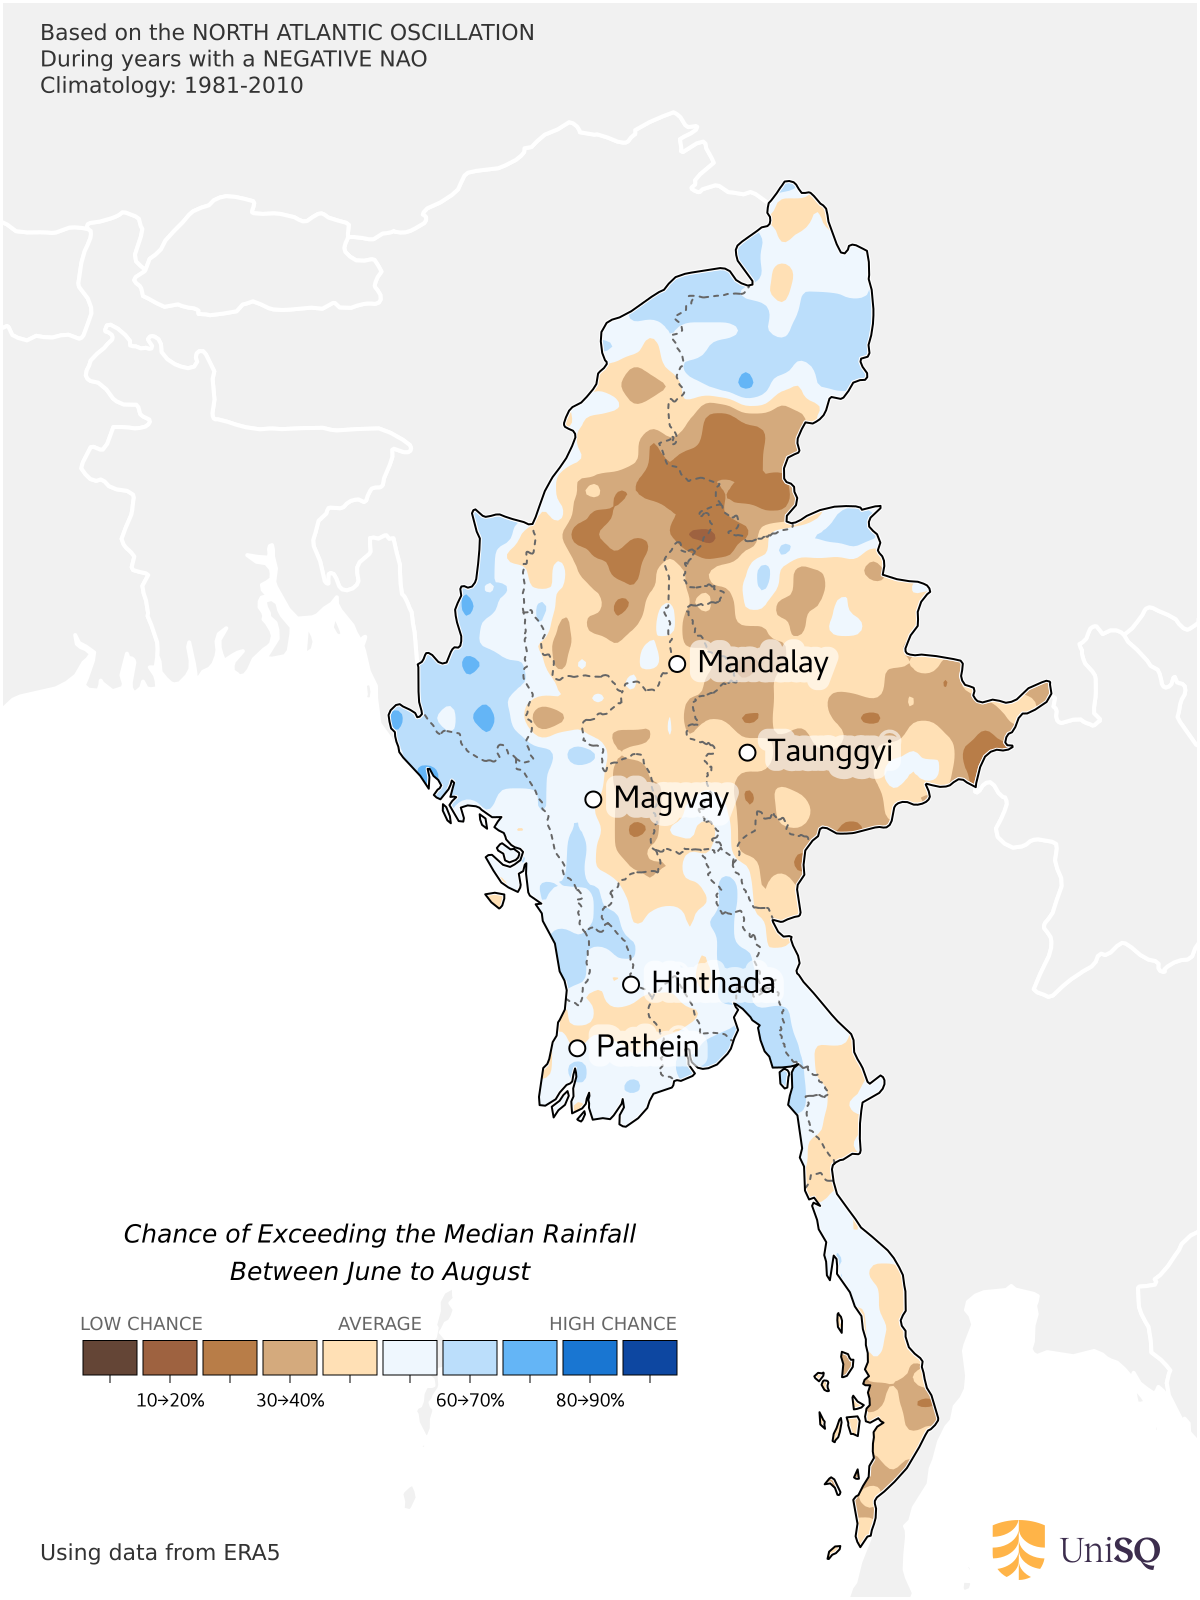
Climate Drivers

Seasonal forecasts provide a long-range outlook of changes in the Earth system over periods of a few weeks or months, as a result of predictable changes in some of the slow-varying components of the system -Copernicus
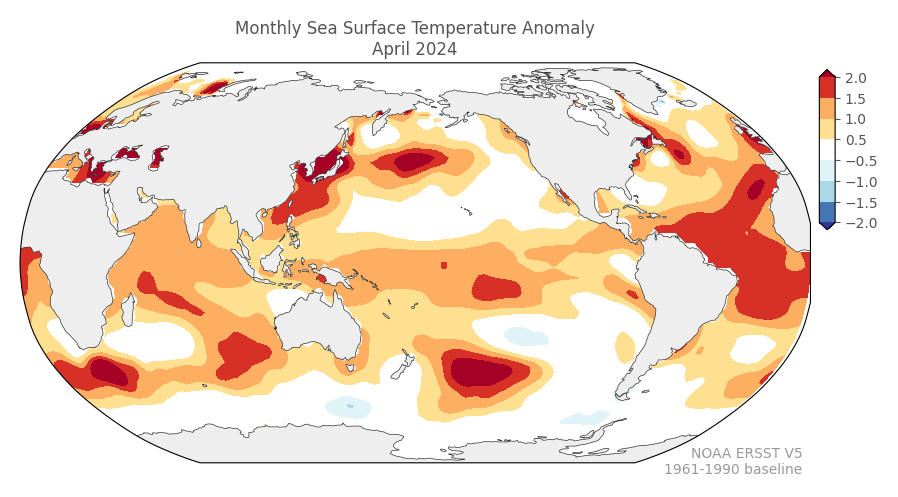
Climate Anomalies

By analysing the long term historical records we can determine what the climate was like when we had similar conditions in the past.

soiphases

November 2023

Image
View All
ONI

November 2023

Image
View All
MEI

November 2023

Image
View All
NINO12

November 2023

Image
View All
NINO3

November 2023

Image
View All
NINO34

November 2023

Image
View All
NINO4

November 2023

Image
View All
IOD

November 2023

Image
View All
NAO

November 2023

Image
View All
AO

November 2023

Image
View All

Hindcast Skill

For each climate driver the skill is calculated by comparing the modelled hindcasts with the observed values for the same region and season using the Australian Gridded Climate Data. For the current set of models the Skill is calculated using the hindcast values from 1993-2016.

  • For the Chance of Above the Median forecasts the skill is determined by using a Hit Score (Percent correct) where a forecasts can be either Right or Wrong (categorical)
  • For the Anomaly Mean forecasts the skill is calculated using the Linear Error in Probability Space (LEPS) which is a scoring system that awards forecasts for being closer to the observed values and penalises the score for being further away.
Please note that there are many different skills testing algorithms which can be used in this framework
soiphases

November 2023

Image
View All
ONI

November 2023

Image
View All
MEI

November 2023

Image
View All
NINO12

November 2023

Image
View All
NINO3

November 2023

Image
View All
NINO34

November 2023

Image
View All
NINO4

November 2023

Image
View All
IOD

November 2023

Image
View All
NAO

November 2023

Image
View All
AO

November 2023

Image
View All